Share this post
We used Storytell to get a $52,950 R&D tax credit
And we did it without having our engineers spend hours on the phone trying to recall what work they did in the past fiscal year
November 7, 2025

We just used Storytell to get a $52,950 R&D tax credit without our engineering team having to spend any time with our R&D tax consultant.
"I usually have to spend hours interviewing product and engineering teams to compile this information." - Maria, R&D Tax Consultant

Even better, our product and engineering team didn't have to spend any time on the phone with our R&D tax consultant trying to rack their brains to remember what work they did in FY24.
Instead, we just created a shared project in Storytell for Maria. We loaded all our Linear engineering tickets into Storytell along with our engineering standup and demo Zoom calls, and had Maria ask questions of the data.
Here's exactly how we did it -- and how you can, too.
Using Storytell to get theR&D tax credit... without spending days to do it
Every year, thousands of companies leave money on the table. Not because they don't qualify for R&D tax credits—they do. But because compiling the documentation is so painful, many simply give up or submit incomplete claims.
At Storytell, we faced this same challenge. Our annual R&D tax credit process meant pulling engineers away from their work for several days of collective effort. It was incredibly difficult to track down all the work from the past year, combing through both Linear tickets and pull requests to remember the "why" behind each decision.
This year, we decided to use our own platform to solve our own problem—and discovered just how transformative the right approach can be.
The R&D tax credit documentation challenge
R&D tax credits can be worth hundreds of thousands of dollars for qualifying companies. But claiming them requires meticulous documentation: detailed descriptions of technical challenges, explanations of why standard solutions didn't work, documentation of iterative development processes, and precise allocation of employee time across qualifying projects.
When our team sat down with our tax credit consultant to tackle Storytell's FY24 R&D tax credit report, we faced a daunting dataset: a CSV file containing 1,808 engineering issues spanning 53 different projects from the fiscal year. Buried within those rows were the major R&D initiatives that represented the bulk of our qualifying work.
The traditional approach would involve:
- Manually reviewing hundreds of tickets to identify large R&D projects
- Scheduling meetings with engineers to recall technical challenges
- Piecing together why standard practices couldn't solve our problems
- Documenting multiple iteration cycles and experimental approaches
- Calculating time allocation percentages for each employee across projects
Each step required cross-referencing information, jogging memories, and translating technical work into tax-compliant language.
Starting simple: From basic query to comprehensive analysis
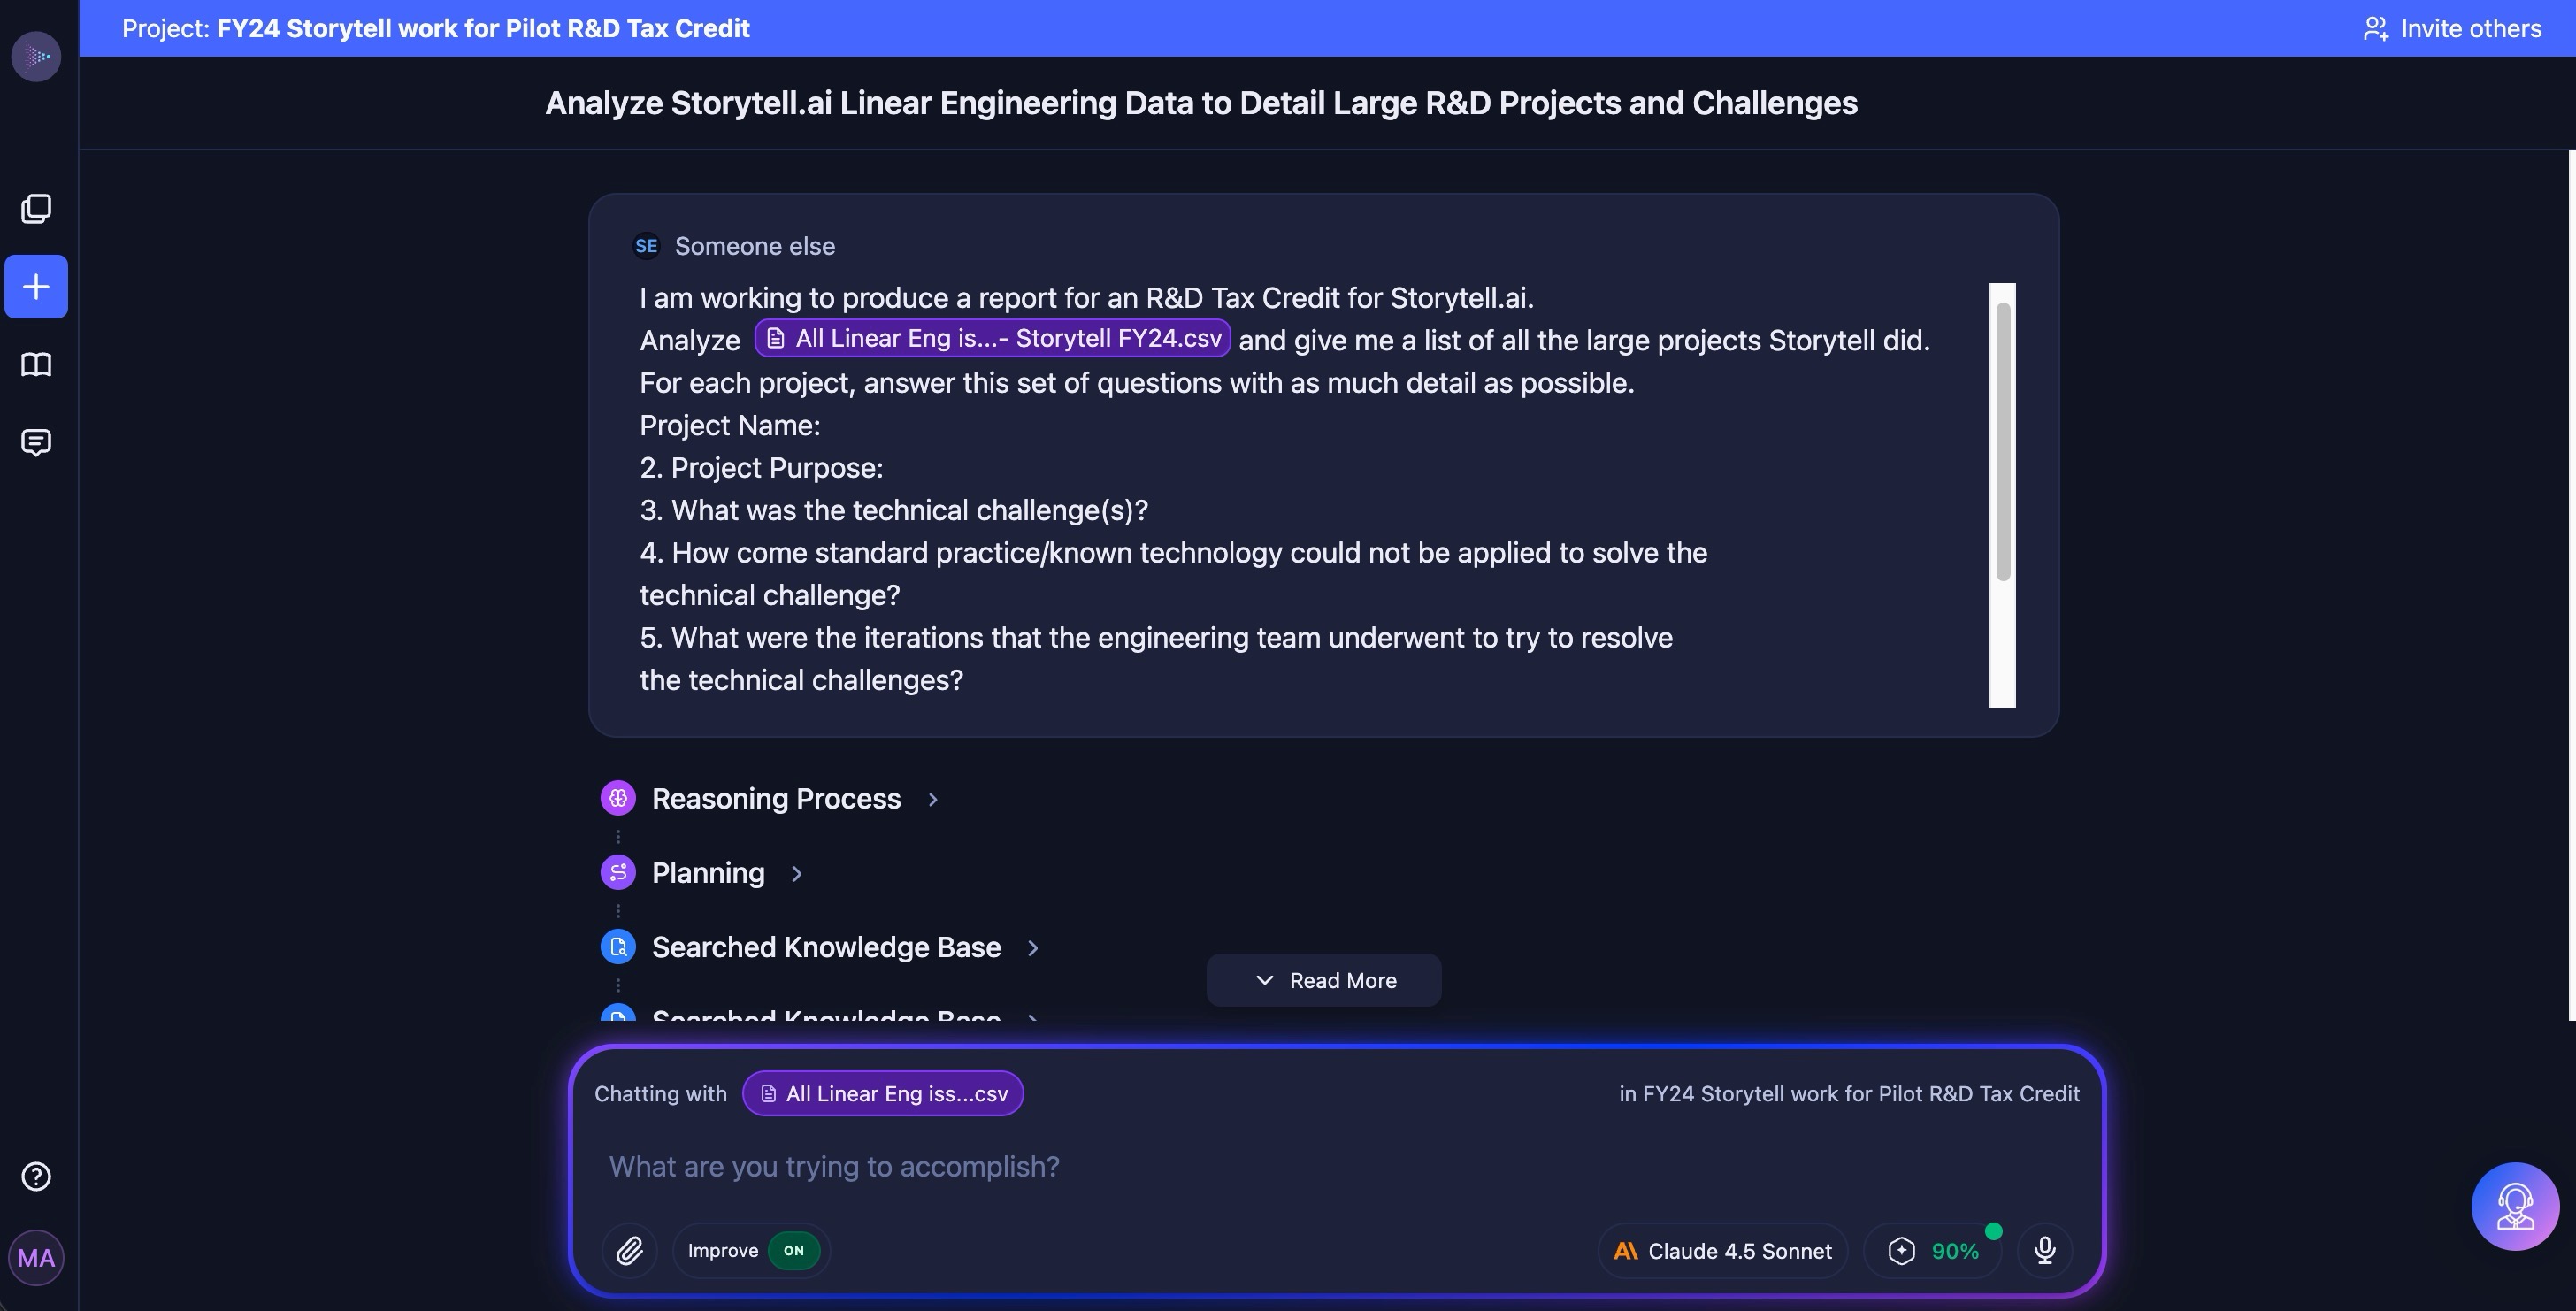
We began by uploading a CSV export of all our FY24 Linear engineering tickets to Storytell. Instead of crafting the perfect prompt, our R&D tax credit consultant started with a direct, structured question to get what was needed for the tax credit report:
"I am working to produce a report for an R&D Tax Credit for Storytell.ai. Analyze @All Linear Eng issues and give me a list of all the large projects Storytell did. For each project, answer this set of questions with as much detail as possible:
Project Name:Project Purpose:What was the technical challenge(s)?How come standard practice/known technology could not be applied to solve the technical challenge?What were the iterations that the engineering team underwent to try to resolve?"
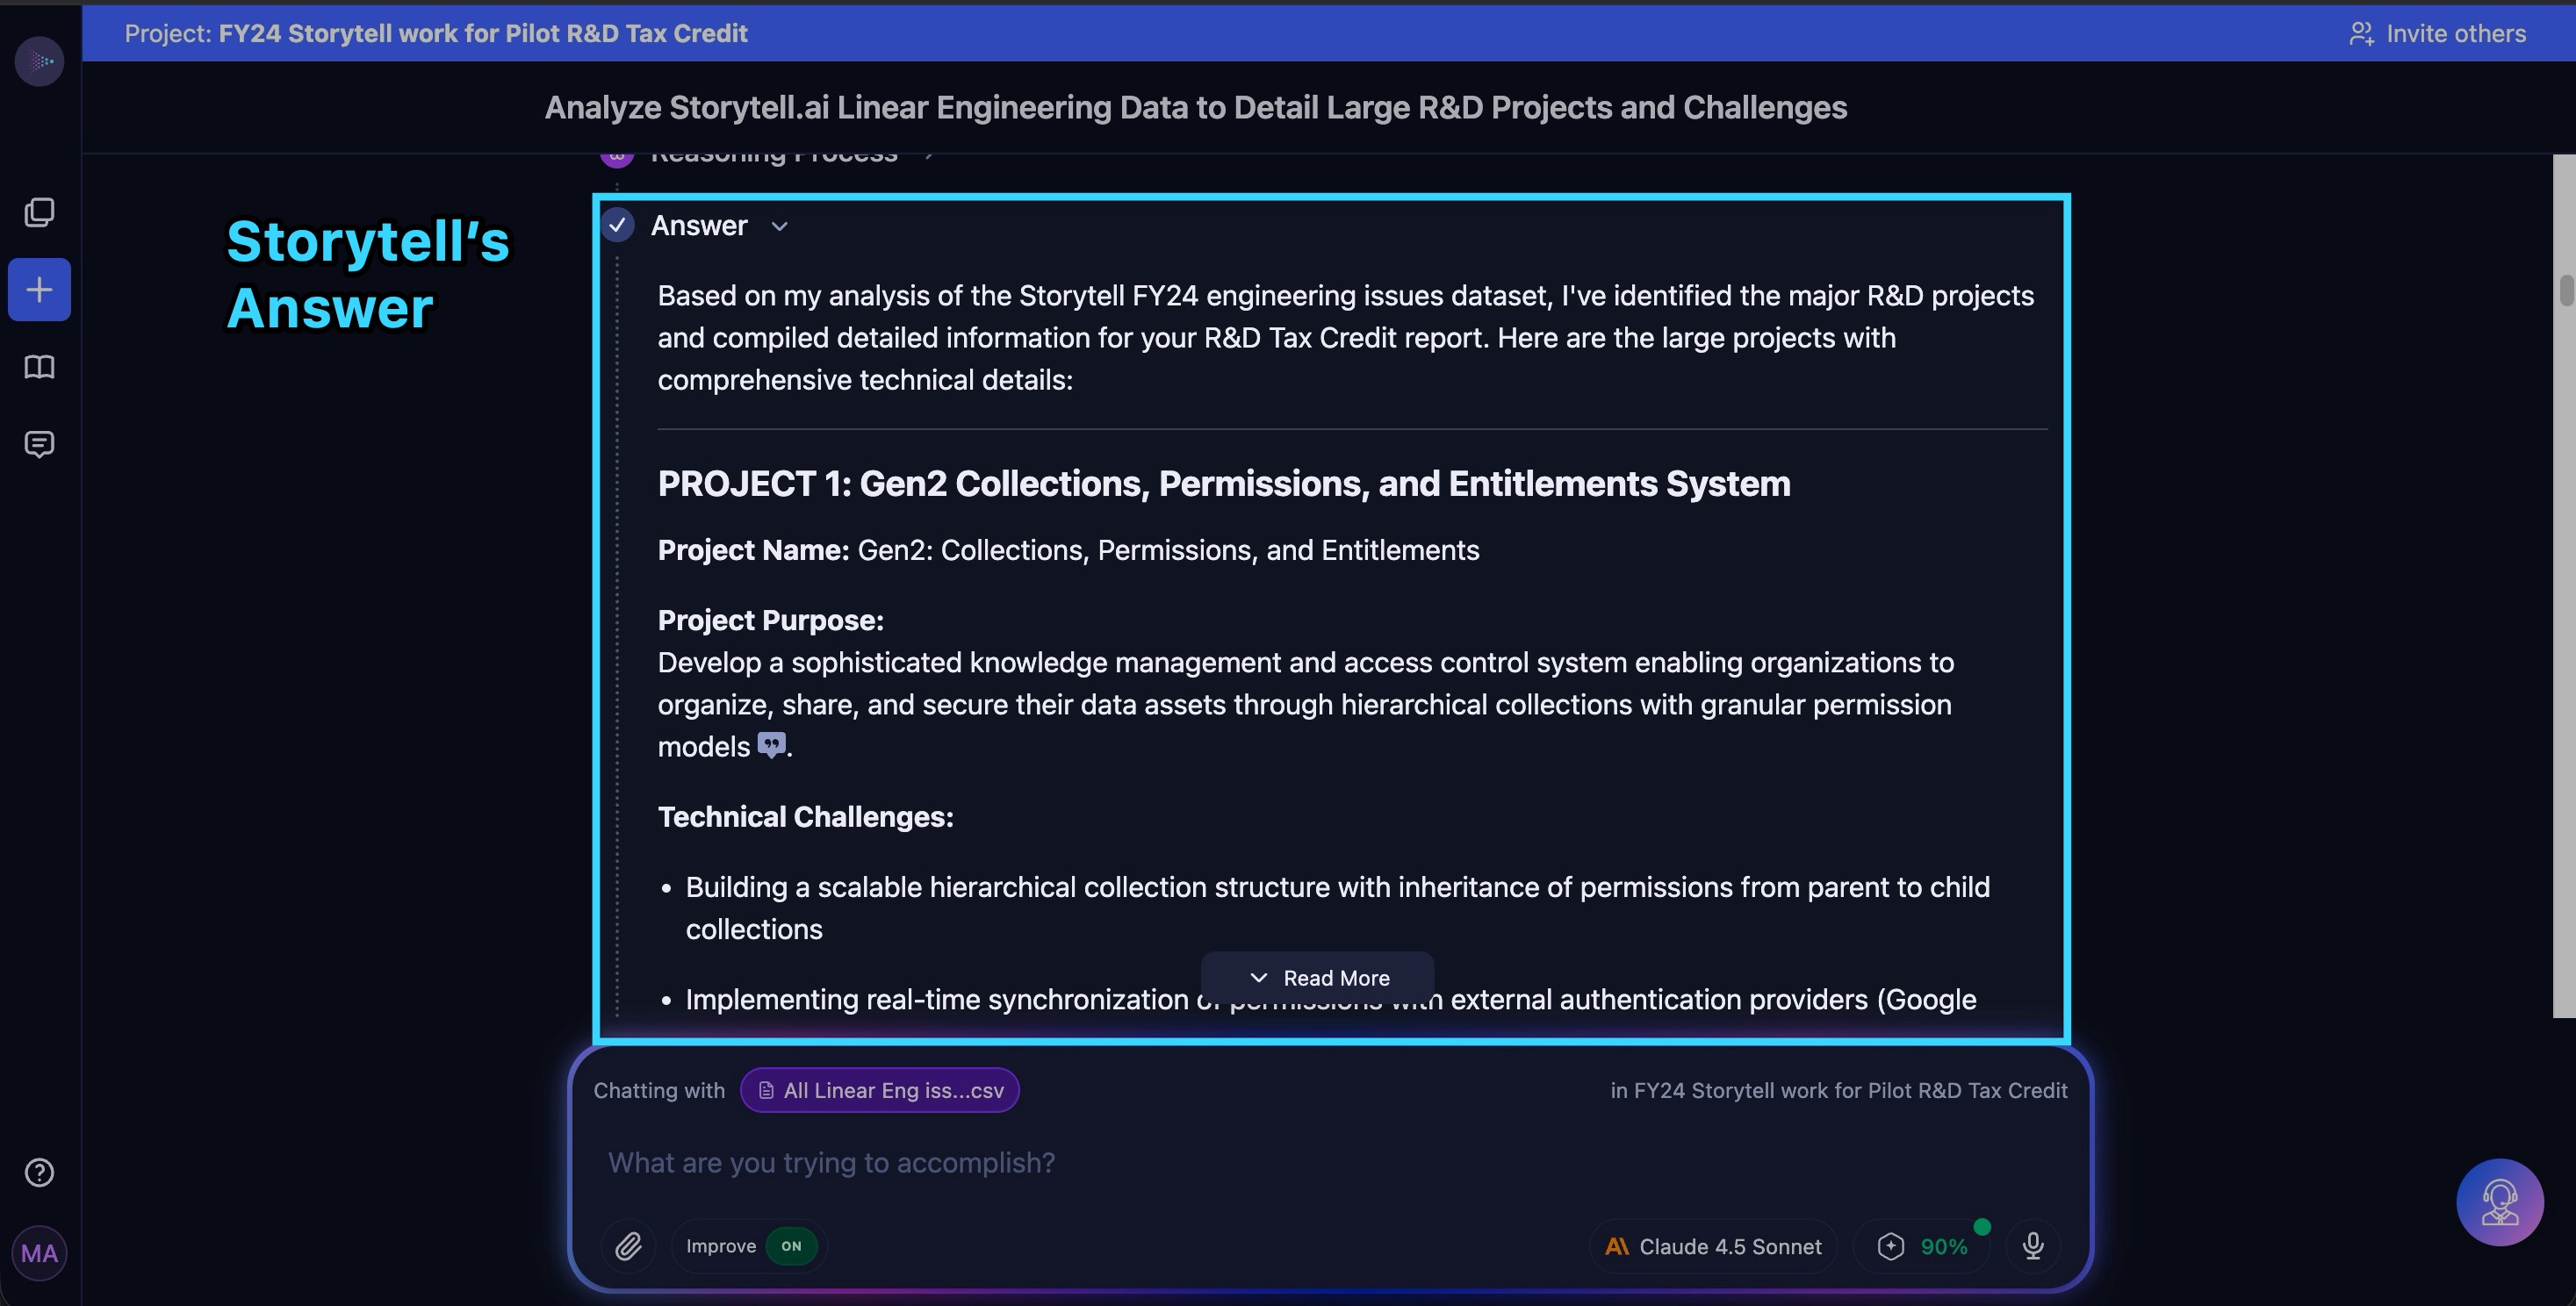
Within minutes, Storytell analyzed all 1,808 issues across 53 distinct projects, identified eight "large" projects with more than 50 associated engineering issues, and generated detailed technical documentation for each.
Layering data sources for richer insights
While the initial analysis from Linear tickets alone was impressive, we realized we could do better. Engineering tickets don't capture everything—they don't include the conversations, debates, and experimentation that happen in meetings.
So we added something unprecedented: Zoom recordings of our engineering stand-up meetings from throughout FY24.
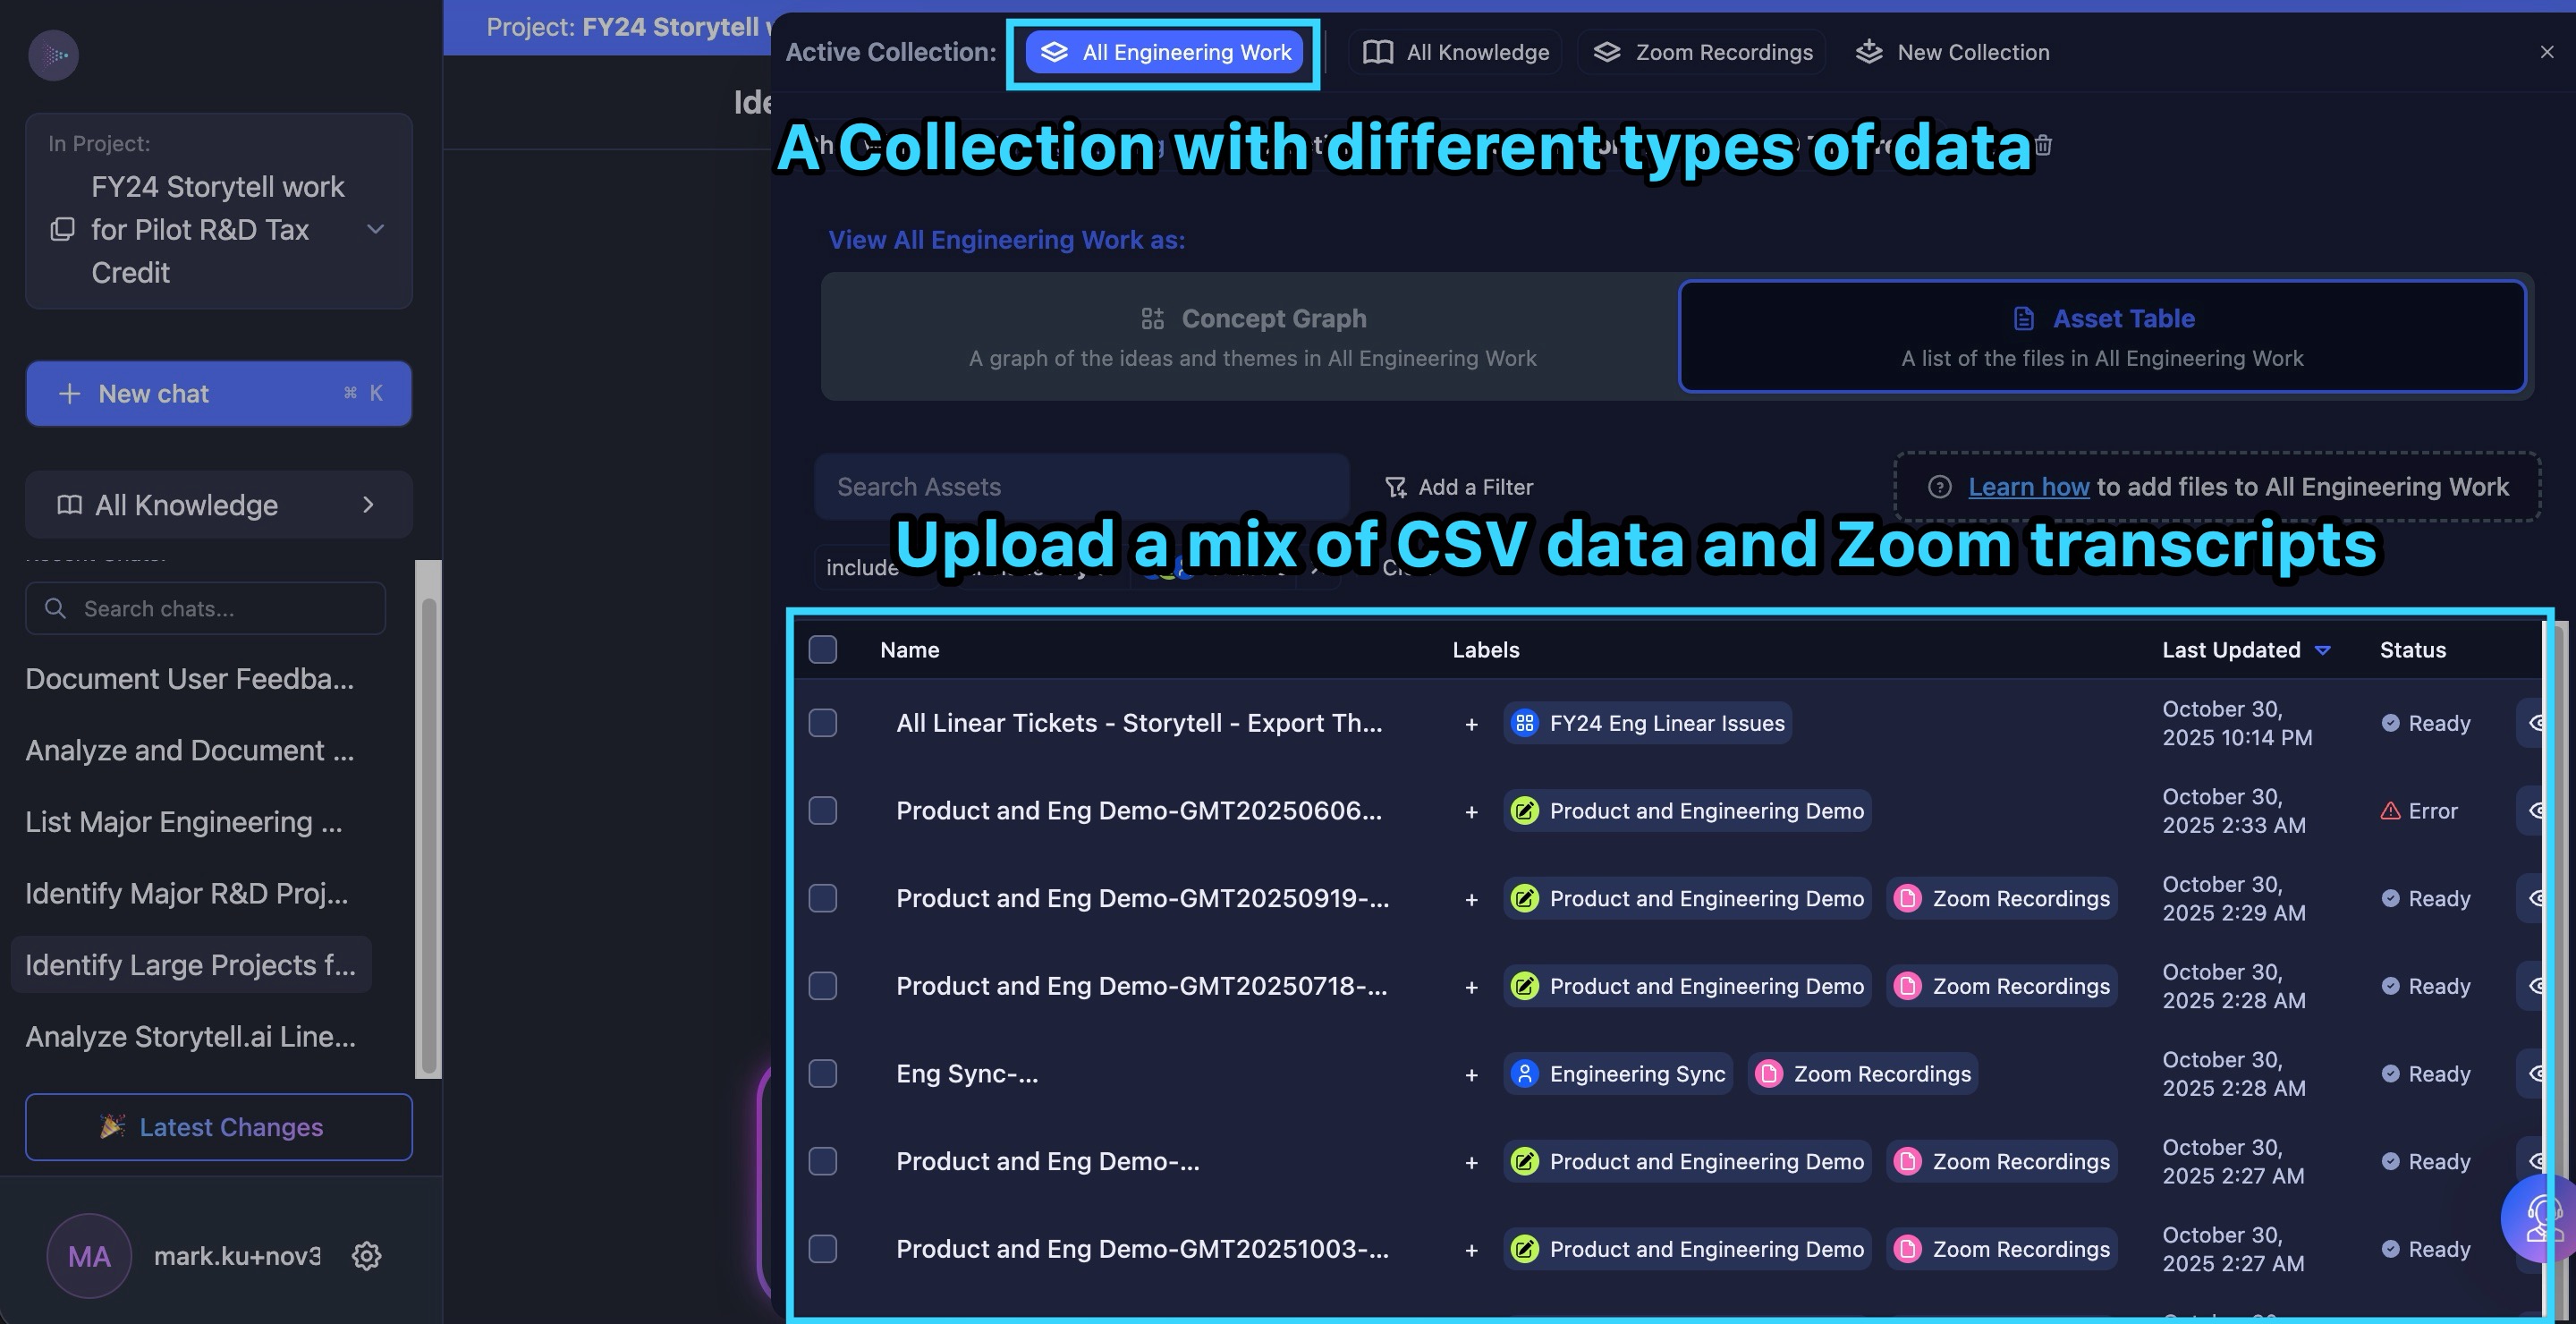
Traditional data analysis tools can't combine these data types—CSV files and video transcripts are fundamentally different formats. But Storytell handled both seamlessly. We created a unified "view" called "All Engineering Work" that encompassed both the Linear tickets and the Zoom transcripts.
Then we re-asked the same comprehensive question: "Analyze all engineering work and give me a list of the large projects that Storytell did".
The difference was striking. The results were "really great, more in-depth" answers. Major initiatives like our platform upgrade—the interface our consultant was actually using during the call—"didn't come through in the first data set but it did here". The Zoom recordings captured context that tickets alone couldn't provide: the reasoning behind architectural decisions, discussions of failed approaches, and explanations of why certain experiments were worth trying.
This ability to analyze "typically incompatible data types like Zoom recordings versus CSVs" together was, as we explained to our consultant, exactly what Storytell was built for.
Drilling deep: From overview to project-specific detail
Our R&D consultant discovered that she could get even more depth by asking about projects individually. After getting the list of eight major projects, she could query for specific details on just one:
"Now I'm going to try asking for this specific project... and now it is doing a search just for that project".
This "step-by-step" approach was "definitely a better way to do it," we observed during the session. Each project response included:
- Project purpose and technical challenges
- Specific references to individual Linear tickets for traceability
- Successful and unsuccessful attempts
- Prototypes developed
- Technologies experimented with
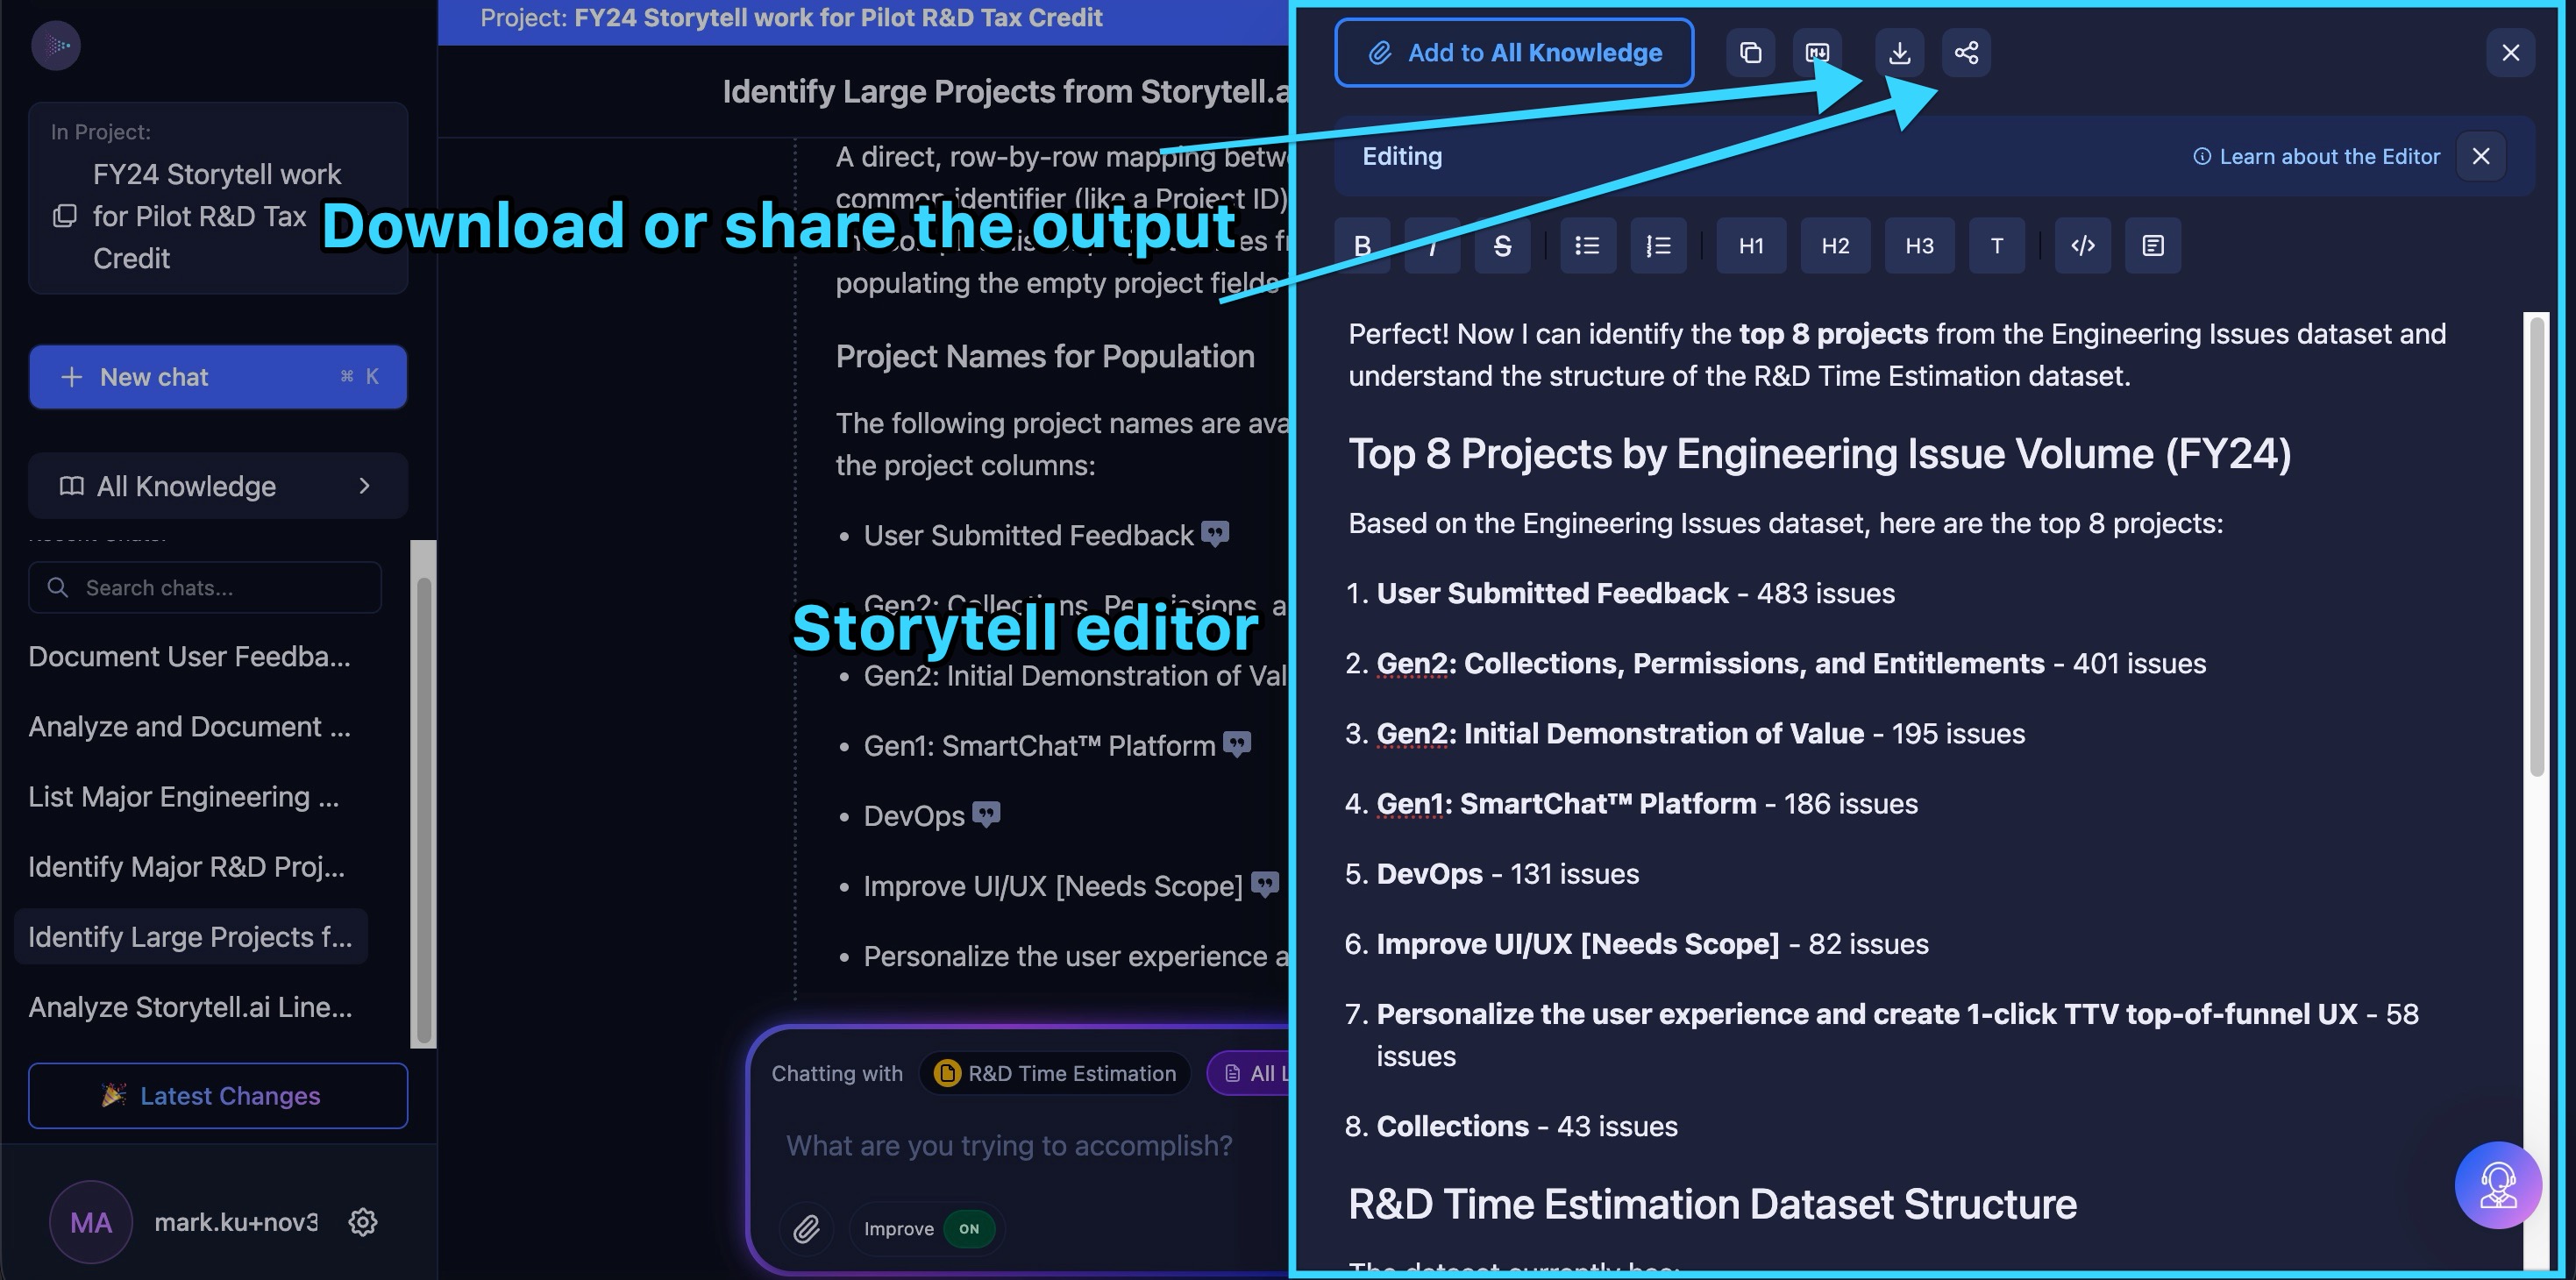
Our R&D consultant could download each analysis as a PDF, copy sections directly, or open the content in an editor for refinement.
The collaborative breakthrough
Perhaps most valuable was the transformation of the R&D consultant relationship. Normally, tax credit consultants schedule calls weeks in advance, interview multiple engineers, then disappear to compile reports. Engineers get pulled away from their work to answer questions about projects they completed months ago.
With Storytell, our R&D consultant could work independently. "Now, you're off to the races. You can just ask all your questions of Storytell," we told her during the demo. She could refine queries in real-time, drill into specific projects, and explore follow-up questions without scheduling another meeting.
When she encountered something unclear, she could simply ask another question within Storytell. The iterative exploration happened in minutes, not days.
Her reaction to seeing the complete project analysis spoke volumes: "Oh my god... It gives me everything I need in minutes".
The vision: Real-time R&D documentation
During the session, we discussed an even more powerful possibility: automated, continuous R&D documentation.
"What I would love to be able to do is not have to do a call 15 days before taxes are due, right? I'd love to just make a project and just as we have Zoom calls, as we do experimentation, that's just all going into a space".
Storytell is building "create an action" functionality that will enable automated workflows. You could set up a rule like: "Any data that's labeled as engineering stand-up data or Zoom internal calls, whenever there's new data that comes in, just run this and send it." Then, as engineers do standup calls and write engineering tickets, it's automatically going to the system.
As our R&D consultant noted, when tax consultants talk to clients at the end of the year, "they've already forgotten what they've done". Real-time documentation solves this problem entirely.
Read more about how to use Storytell here
Key insights that made this work
Several factors enabled this efficient approach:
- Structured data pays dividends: Because we tracked our engineering work systematically in Linear, we had a rich dataset ready for analysis.
- Multi-source analysis unlocks hidden insights: Adding Zoom recordings to ticket data revealed major projects that weren't fully captured in tickets alone. The ability to analyze "typically incompatible data types" together was game-changing.
- Natural language queries enable exploration: Using conversational prompts to extract exactly what was needed for the tax credit report made the process straightforward.
- AI understands context: Storytell didn't just search for keywords. It understood relationships between technical challenges, standard practices, and iterative development—the exact narrative required for R&D tax credit claim.
- Flexible querying strategies: The ability to query all projects at once for an overview, then drill into individual projects for depth, gave consultants control over their workflow.
- Vision capabilities extend the platform: Being able to "literally just take a screenshot" of a spreadsheet and upload it removed barriers to data integration.
The "dogfooding" advantage
There's something powerful about using your own product to solve your own problems. It gave us:
- Confidence in the solution: We experienced firsthand the time savings and accuracy improvements.
- Product insights: We identified features that matter most for complex analytical tasks, like the ability to layer different data sources and query at different levels of depth.
- Authentic storytelling: We can share genuine results, not hypothetical benefits. Our consultant's reaction—"It gives you everything"—wasn't staged.
- Credibility with customers: If we trust it for our own tax credits, customers can trust it for theirs.
- Discovery of new use cases: The vision ingest capability for spreadsheets emerged organically during the session, showing us capabilities we hadn't fully explored.
A glimpse of the future
The most exciting insight from this session wasn't just that we completed our R&D tax credit work efficiently. It was realizing the broader implications.
As we told our R&D consultant: "I'm so excited to see what this enables for you, but also what we can do more broadly for your other customers. You can do this for many people."
Tax credit consultants could scale their practice dramatically if every client had their engineering data organized and queryable like this. Companies could maintain continuous R&D documentation instead of scrambling annually. Engineering teams could avoid interruptions for tax season interviews.
The vision of real-time, automated R&D documentation isn't far off. As engineering work happens—captured in tickets, discussed in meetings, demonstrated in code—it flows into Storytell. When tax season arrives, the documentation is already there, waiting to be exported.
Ready to transform your R&D documentation?
If you're facing an upcoming R&D tax credit filing, your data is likely already sitting in Linear, Jira, or GitHub. Maybe you even have Zoom recordings of engineering meetings. The question isn't whether your engineering work qualifies for R&D credits. It's whether you can efficiently prove it does.
At Storytell, we've proven that the answer is yes—and we used our own platform to do it. What took days now takes hours. What required multiple engineering interviews now happens through natural language queries. What was scattered across incompatible data sources now comes together in a unified analysis.
Here's you can do that too:
- Sign up for a Storytell account
- Upload your files
- Add Labels or create a Collection
- Chat with your data
That's the power of dogfooding. And that's the future of R&D tax credit documentation.
Gallery
No items found.
Changelogs
Here's what we rolled out this week
No items found.

.jpg)
